Addressing Climate Change
Basic Approach
Glass manufacturing processes require a significant amount of energy, and we have made it a top priority to reduce the greenhouse gas emissions from our melting furnaces.
In November 2021, we declared our adoption of the Task Force on Climate-related Financial Disclosures (TCFD*1) recommendations for analyzing the risks and opportunities that climate change poses to our business. Our efforts include disclosing the potential financial impacts of the risks and opportunities and details about the measures, indicators and targets of our Carbon Neutrality Action Plan*2. Our goal is to be the world’s most efficient and environmentally friendly glass manufacturer.
-
TCFD dissolved in October 2023 and was succeeded by the International Financial Reporting Standards (IFRS) Foundation.
-
For further details about our Carbon Neutrality Action Plan, please see the column on “Indicators and Targets” in the section “Initiatives to Achieve Targets.”
Oxy-Fuel Firing Glass Melting Furnaces
An oxy-fuel firing furnace differs from an air combustion furnace in that nitrogen is not taken into the furnace, which means that less exhaust gas (and consequently exhaust heat) is produced, thus reducing fuel consumption and CO2 emissions. Furthermore, the generation of thermal nitrogen oxides (NOx) in a furnace is reduced. In fiscal 1993, we installed Japan’s first oxy-fuel firing glass melting furnace. This technology has now been adopted for almost all of our furnaces.
Fuel Conversion in Glass Melting Furnaces
For more than 20 years, we have been shifting to fuels that produce lower carbon emissions, actively switching to the use of natural gas. In fiscal 2010 we completely stopped using heavy oil, and in fiscal 2024 we achieved a natural gas usage rate of 99.6%.
We are currently developing combustion technologies that do not emit CO2. In fiscal 2022, we developed a hydrogen–oxygen combustion burner, which runs entirely on hydrogen fuel, and used it successfully in glass melting demonstration experiments. The combination of hydrogen fuel and oxygen combustion technology makes possible highly efficient glass melting.

Carbon Neutral Initiatives
Governance and Risk Management
The figure on the right shows our governance structure for CSR, including for climate-related risks and opportunities.
Board of Directors
The Board of Directors makes decisions on important management affairs of the NEG Group and supervises the execution of business affairs. In management issues related to climate-related measures, the Board of Directors creates systems, formulates measures and targets on priority issues to be addressed and resolved, and evaluates and provides advice on measures executed by the president, who acts as the person responsible for business execution. Outside officers (four outside directors and two outside corporate auditors) participate in meetings of the Board of Directors.
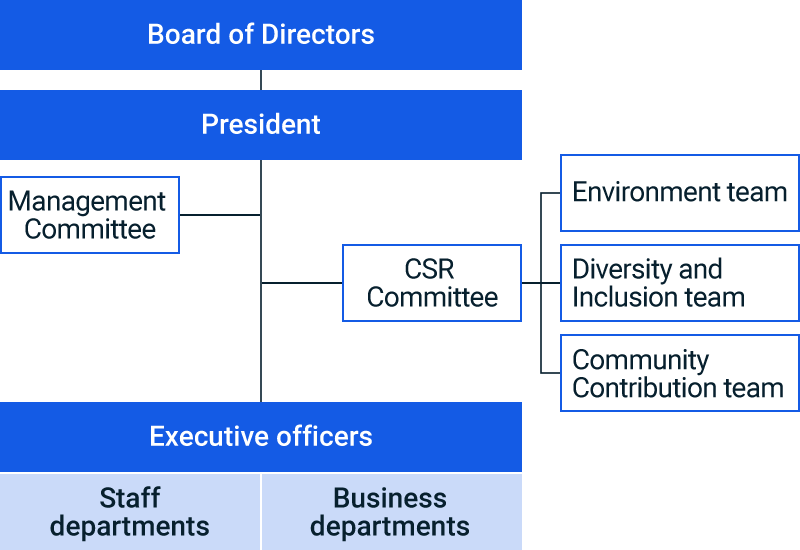
President
The president is responsible for the execution of business and implements measures in accordance with the resolutions and advice of the Board of Directors.
Management Committee
The Management Committee deliberates matters important to company management and draws up detailed action plans for decisions made at the Board of Directors meetings.
CSR Committee
The CSR Committee engages in comprehensive discussion about the direction and content of climate-related measures and other CSR activities, and takes a flexible approach to developing related activities. The committee also addresses broad sustainability-related challenges, such as ESG and the SDGs, centered on the three priority CSR themes of the environment, diversity and inclusion, and community contribution. Comprised of CSR-related department heads and other managers, the committee is chaired by an executive officer in charge of general affairs and has a secretariat based in the General Affairs Division. To increase the effectiveness of our initiatives, three working teams have been established to address the priority themes. The Environment Team handles climate change response and environmental preservation, the Diversity and Inclusion Team handles human capital and human rights, and the Community Contribution Team handles educational support and similar matters.
The CSR Committee develops basic CSR policies, identifies priority issues, and plans, reviews, and implements measures to address them. It also formulates and evaluates information disclosure policies and content, and submits recommendations and reports to the Management Committee and Board of Directors.
The CSR Committee’s Environment Team handles climate-related matters and the TCFD framework. The team conducts hearings with staff and business departments to identify and review climate-related risks and opportunities, and evaluates and reviews business impact based on scenario analysis. The division responsible for these risks and opportunities promotes the Carbon Neutrality Action Plan, which is central to the Group’s strategic resilience. The Environment Team regularly verifies progress and reports to the CSR Committee. The committee drafts, discusses, and supports divisional activities related to the reported items from the standpoint of sustainability. In addition, the committee drafts and discusses the policy for data disclosure and content and, when deemed necessary, provides recommendations and reports to the Management Committee and Board of Directors.
Executive officers, departments, and staff departments
We endeavor to mitigate climate-related risks and capitalize on opportunities through the carbon neutrality action plan and other initiatives.
The climate-related risks and opportunities, as well as countermeasures, identified and evaluated by the CSR Committee are integrated in the periodic risk auditing conducted by the NEG Group in line with our basic policy on internal control. The division responsible for risks and opportunities promotes countermeasures.
Strategies
Scenario analysis
We have carried out the following scenario analysis in order to evaluate the business impacts under different scenarios, as well as to evaluate our strategic resilience with regard to climate-related risks and opportunities.
Businesses targeted for analysis
All NEG Group businesses are targeted for analysis.
Evaluation timeline
The impact on the NEG Group’s business by major climate-related risks and opportunities identified from scenario analysis was evaluated on a timeline focused on the year 2030.
Analysis steps
| Step 1 | Identify important climate-related risks and opportunities; establish parameters |
|---|---|
| Step 2 | Establish climate-related scenarios |
| Step 3 | Evaluate business impact under the different scenarios |
| Step 4 | Evaluate strategic resilience with regard to climate-related risks and opportunities; investigate further countermeasures |
Established scenarios
| Category | Scenario overview | Main reference scenarios |
|---|---|---|
| 1.5°C/2°C scenario | This scenario involves the enactment of policies and regulations aimed at achieving a decarbonized society and which seek to keep global warming to within 1.5°C/2°C above the pre-industrial revolution global temperature. Compared with the 4°C scenario, the transition risks are high, but the physical risks can be kept low. Demand for products that contribute to the achievement of a decarbonized society will become high. |
|
| 4°C scenario | This scenario involves a future where the policies and regulations, which various countries have announced are fulfilled, but no new policies or regulations are introduced. Energy-derived CO2 emissions continue to increase worldwide. Compared with the 1.5°C/2°C scenario, transition risks are low, but the physical risks will grow larger. |
|
Major Climate-related Risks and Opportunities Identified, Evaluation of Impact on Business, and Countermeasures
| Type | Risks and opportunities | Impact on business | Countermeasures | |
|---|---|---|---|---|
| Transition risks | Policy and legal | Carbon pricing introduction and increase | Increase in manufacturing costs 1.5°C/2°C: 21 billion yen 4°C: 4 billion yen |
Enactment of the carbon neutrality action plan |
| Technology | Investment in manufacturing facilities to reduce CO2 emissions | Increase in depreciation costs Impact on business*¹: Medium |
||
| Reputation | Negative criticism of energy-intensive companies | Decreased sales*² | ||
| Market | Increase in energy prices | Increase in logistics costs Impact on business*¹: 1.5°C/2°C: Medium; 4°C: Medium |
Maintain good relationships with suppliers, pursue supplier development and diversification, switch to generic items | |
| Soaring glass raw material prices due to changes in the supply and demand structure for resources | Increase in procurement costs*² | |||
| Physical risks | Acute | Negative impact on operations and logistics due to increased frequency of disasters, extreme weather, typhoons, and flooding | Decreased sales*² Increase in facility repair costs*² |
Implement business continuity planning, carry out disaster prevention activities, disperse operations among different manufacturing bases |
| Chronic | Negative impact on operations due to drought | |||
| Opportunities | Resource efficiency | Reduced energy consumption and Scope 1 + Scope 2 CO2 emissions as a result of highly efficient production (implementation of carbon neutrality action plan) | Reduction in manufacturing costs Impact on business*¹: 1.5/2°C: High; 4°C: High |
Enactment of the carbon neutrality action plan |
| Products | Increased demand for low-carbon products (thin sheet glass for FPDs), which contribute to reduced production and shipping costs in customer processes | Increased sales*² | Promote R&D; pursue active sales to respond to new needs | |
| Increased demand for glass fiber for strengthening functional plastics, which will be used to lighten automotive bodies and in battery casings as EVs become more widespread | ||||
| Market | Increased demand for all-solid-state Na-ion batteries as they go to market and society transitions to becoming decarbonized | |||
-
Estimation of impact on business
Low: < 10 billion yen; Medium: ≥10 billion yen but < 30 billion yen; High: ≥ 30 billion yen
-
Due to a lack of data for calculating impact on business, qualitative descriptions are utilized.
Strategic Resilience
Following updates to the reference scenarios, we reviewed impacts on business. The impact has changed due to global inflation and other factors that have led to soaring costs for raw material and fuel, and fluctuations in foreign exchange rates. We are incorporating new technologies and solutions from inside and outside the company, and implementing the Carbon Neutrality Action Plan and other initiatives to further fortify our business resilience.
Metrics and Targets
Cognizant of the pressing and global need for climate change action, we pursue sustainable manufacturing practices and strive to effectively address climate change. In February 2022, we set Scope 1 + Scope 2 CO2 emissions reduction targets for fiscal 2030 and committed to achieving carbon neutrality by fiscal 2050. We are undertaking ambitious measures to achieve our targets, including introducing all-electric melting furnaces across our product lines, switching over to energy-efficient facilities, and investing in renewable energy. In addition, we have created a system for calculating and disclosing Scope 3 emission volume data.
CO2 Emissions Reduction Targets (Scope 1 + 2)
CO2 Emissions Reduction Targets
-
Reduce CO2 emissions by 36% and emissions intensity* by 60% in fiscal 2030 (compared to fiscal 2018)
-
Achieve carbon neutrality by fiscal 2050
-
Production weight ratio
Initiatives to Achieve Targets
In order to achieve CO2 emissions reduction targets, the NEG Group has created a carbon neutrality action plan, which involves a variety of initiatives, focusing primarily on those in the table at right. Through these, we will achieve our targets by 2030, after which we will pursue improvement activities that will make us carbon neutral by 2050.
| Category | Scenario overview |
|---|---|
| Manufacturing process | • Promoting all-electric melting and improving melting efficiency |
| • Switching to energy-saving facilities | |
| • Technological improvement and electrification for forming and processing facilities | |
| • Operations automation and optimization | |
| Utility facilities | • Upgrading to high-efficiency facilities |
| • Facility optimization | |
| • Operation optimization | |
| Technological development | • Combustion technology development for CO2 -free fuel (hydrogen, etc.) |
| Procurement | • Investment in and procurement of renewable energy |
Progress of the Carbon Neutrality Action Plan
Installation of All-electric Melting Furnances
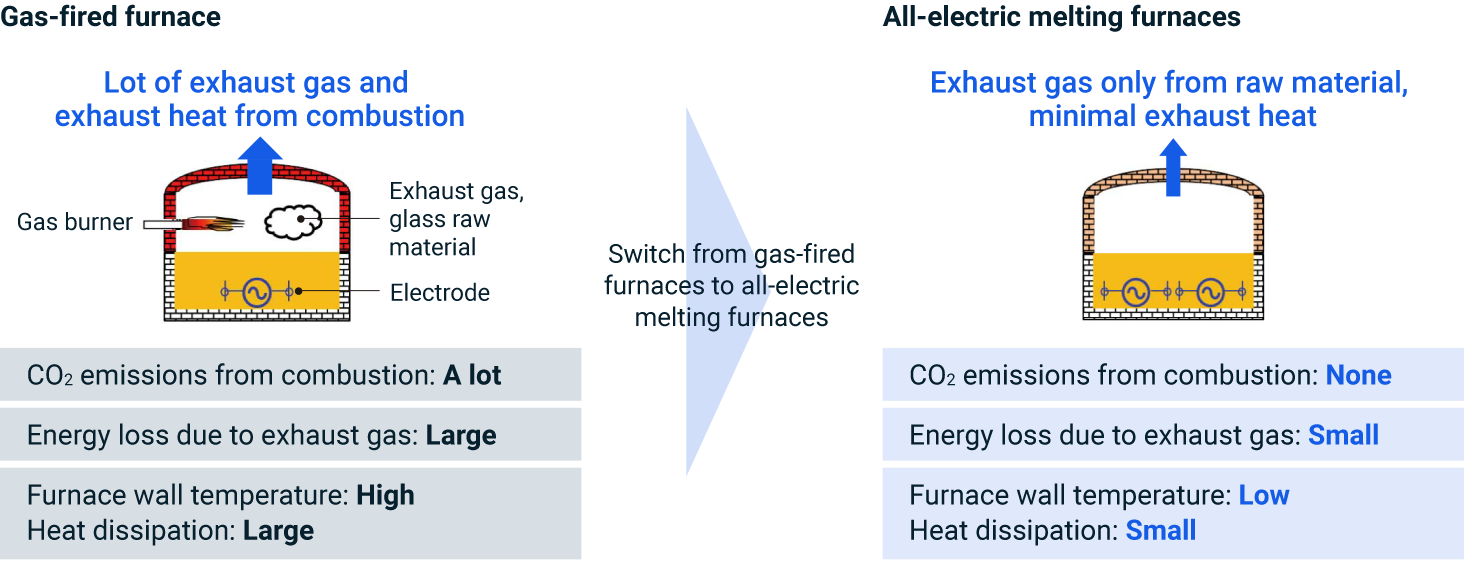
We currently use both gas and electricity as power sources for our glass melting processes. When using electricity, we insert electrodes into the molten glass, a method of heating that uses the direct passage of electric current. This method is highly energy efficient and produces less exhaust heat than gas combustion. Electric processes also make it possible to reduce carbon emissions even further by introducing renewable energy sources. We are currently shifting to hybrid melting furnaces partially powered by electricity and ultimately intend to incorporate all-electric melting furnaces.
Gas-fired furnace and All-electric melting furnace
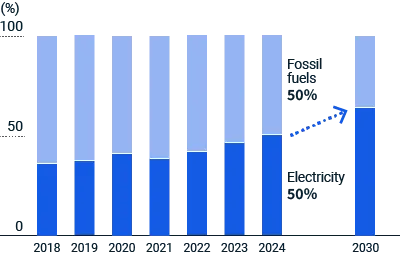
Percentage of all-electric melting

Electrification for melting, forming, and processing facilities
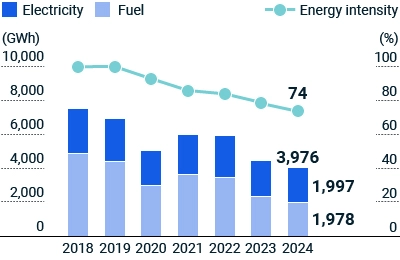
Improving Energy Usage Efficiency
In fiscal 2021, we launched an energy business plan aimed at making energy usage visible across our global manufacturing processes (melting, forming, processing) and utility facilities. The plan focuses on promoting energy efficiency and reducing wasteful energy consumption.
We use the data we obtain to analyze and plan measures to boost productivity and with the aim of continually reducing energy intensity (the ratio of production weight). Each business division formulates specific plans to improve energy efficiency and meet intensity targets and applies the PDCA cycle to improve the effectiveness of their efforts. The targets and improvement measures align with our carbon neutrality action plan.
As of fiscal 2024, our energy intensity had decreased by 26% compared to fiscal 2018.
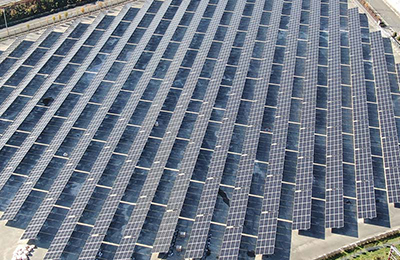
Utilizing Renewable Energy
We use renewable energy for part of our electricity consumption in order to reduce its CO2 emissions.
The Shiga-Takatsuki Plant installed a solar power system with an estimated annual output of approximately 3.7 GWh. The system went into full operation in April 2023. Electric Glass (Guangzhou) Co., Ltd. installed a solar power system with an estimated annual output of approximately 1.3 GWh on the roof of its factory in January 2023.
In fiscal 2024, the Group’s total renewable electricity usage, including both in-house generation and purchased electricity, amounted to 17 GWh, accounting for 0.9% of the Company’s total electricity consumption.
To further reduce our carbon footprint, we have entered into Virtual Power Purchase Agreements (VPPAs) with renewable energy providers. Through our VPPA with a solar power plant in Mie Prefecture, we achieved a 608 t-CO₂ reduction in fiscal 2024. Additionally, in July 2024, we entered into a VPPA for solar power generation in Malaysia, which is expected to deliver an estimated 41,000 t-CO₂ annual reduction starting in fiscal 2026.
CO2 Emissions, CO2 Emissions Per Unit of Production
Due mainly to structural reform in the displays and composites businesses in FY2023, CO2 emissions (Scope 1 + 2) in FY2024 declined from the previous fiscal year. CO2 emissions intensity (Scope 1 + 2) was stable on a unit basis from the previous fiscal year. We are also continuing to calculate Scope 3 emissions to gain a comprehensive understanding of emissions throughout the supply chain.
CO2 Emissions (Scope 1 + 2) *¹

-
Calculated based on the GHG Protocol and ISO 14064.
Scope 2 figures calculated using a market-based approach.
-
Production weight ratio
CO2 Emissions (Scope 3)
(1,000 tons CO2e)
| Category | Fiscal 2024 | |
|---|---|---|
| 1 | Purchased Goods and Services | 530 |
| 2 | Capital Goods | 103 |
| 3 | Fuel and Energy-related Activities | 191 |
| 4 | Upstream Transportation and Distribution | 497 |
| 5 | Waste Generated in Operations | 12 |
| 6 | Business Travel | 1 |
| 7 | Employee Commuting | 3 |
| 8 | Upstream Leased Assets *1 | (Excluded categories) |
| 9 | Downstream Transportation and Distribution *2 | (Excluded categories) |
| 10 | Processing of Sold Products *2 | (Excluded categories) |
| 11 | Use of Sold Products *3 | (Not applicable) |
| 12 | End-of-life Treatment of Sold Products | 188 |
| 13 | Downstream Leased Assets *4 | (Not applicable) |
| 14 | Franchises *4 | (Not applicable) |
| 15 | Investments *4 | (Not applicable) |
| Total: | 1,524 | |
-
Category 8: Included in Scope 1 + 2 emissions.
-
Categories 9 and 10: Calculated figures are not included because obtaining them is complicated by the variety of shipment destinations and the different ways customers use the products.
-
Category 11: No products directly emit GHG during use.
-
Categories 13, 14, 15: No business activities fall under these categories.
-
Emissions intensity figures are derived from the Japanese Ministry of the Environment’s Database for Calculating Greenhouse Gas Emissions from Organizations through the Supply Chain Ver. 3.4 and the Inventory Database for Environmental Analysis (IDEA) Ver 3.4.1.